

Most content reports are packed with numbers that look impressive and say very little. Page views climb, time on page holds steady, and shares tick up, yet leadership still asks the same question: is any of this helping the business? That gap between engagement data and real outcomes is exactly where content budgets get cut. This blog outlines how to build content performance reports that connect what readers do with what the business needs, from choosing the right metrics to presenting results in a way decision-makers actually trust.
Key Takeaways
- Engagement metrics matter most when they connect to a business goal.
- Every piece of content should have a clear job, such as attracting, nurturing, or converting.
- Micro-conversions bridge the gap between reading and buying.
- Attribution settings shape how much credit content receives.
- Good reports explain what changed and what to do next.
Why Engagement Numbers Alone Fall Short
Engagement metrics measure attention. Page views, scroll depth, engaged time, and return visits show whether people find your content and stick with it. That is useful information, but attention is not the same as value. A blog post can attract thousands of visits from readers who will never become customers, while a modest page with a few hundred views quietly drives a steady stream of qualified leads that the sales team loves. Engagement tells you that something caught a reader's eye, but it rarely tells you why it matters to the business.
When reports focus only on traffic and engagement, they end up rewarding the wrong content. Teams chase topics that bring volume instead of topics that bring buyers, and the reports themselves become something stakeholders skim and forget. The fix is not to throw engagement data away. It is to place that data inside a chain that leads to outcomes the business already tracks, such as leads, sales, retention, or savings in support time.
Start With the Job Each Piece of Content Is Meant to Do
Not every article should be judged by the same yardstick. A top-of-funnel guide exists to attract new visitors and build awareness. A comparison page helps people who are weighing their options. A case study supports buyers who are close to making a decision. If all three are measured only by conversions, the awareness content will always look like a failure, even when it is doing exactly what it was created to do.
Assigning a clear role to each piece before it is published makes reporting far more honest. Awareness content can be judged on new users and engaged sessions, nurturing content on return visits and email signups, and conversion content on form fills and calls. Rating each asset against its own purpose, rather than one blanket number, is where content scoring metrics every marketing team should track become genuinely useful.
Building the Bridge With Micro-Conversions
Few readers go straight from a blog post to a purchase. Most take smaller steps first, and those steps are where reporting starts to become meaningful. Micro-conversions are the actions that signal growing interest: subscribing to a newsletter, downloading a checklist, watching a product video, clicking through to a service page, or using a pricing calculator. Each one shows a reader moving a little closer to becoming a customer. Tracking them turns a vague sense of interest into a measurable path you can report on.
Tracking these actions as events in your analytics platform lets you connect content to progress, not just final sales. For example, a report might show that a guide sent 140 visitors to a service page last month and that 12 of them later submitted a contact form. That kind of story is far easier for decision-makers to follow than a list of page views, and it points straight to the content that deserves more investment.
Useful Micro-Conversions to Track
- Newsletter and email list signups.
- Clicks from articles to service or product pages.
- Downloads of guides, templates, or checklists.
- Video plays and interactive tool usage.
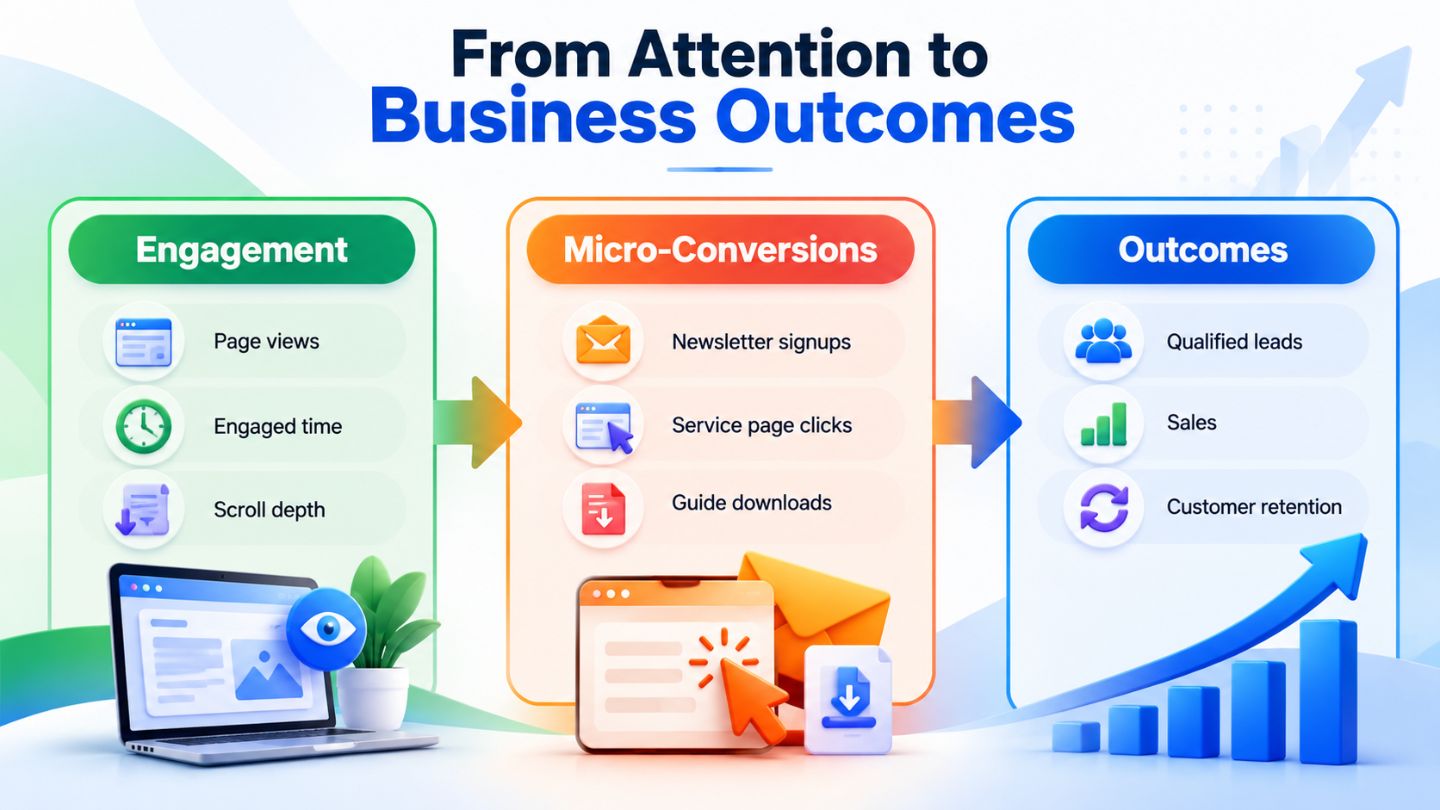
Strong reports trace a clear path from reader attention to measurable business results.
Getting Attribution Right
Attribution decides how credit is shared when a customer interacts with several touchpoints before converting. Under a last-click view, a blog post that introduced a buyer weeks earlier often receives no credit at all, because the final visit came from a branded search or an email. That makes content look much weaker than it really is and can lead to cutting the very pages that start customer journeys. Weighing first-click vs last-click attribution is the clearest way to see how much credit each touchpoint deserves.
Reviewing attribution settings is one of the quickest ways to make content reports more accurate. Comparing data-driven and last-click views side by side shows how often content assists conversions without closing them. Recent changes, such as Google Analytics introducing flexible attribution windows for conversion tracking, also give teams more control over how long a touchpoint stays eligible for credit, which matters for longer sales cycles.
Turning Data Into a Report People Actually Read
The best reports are short, consistent, and built around decisions. Start with a summary of results against goals, then highlight the few pieces of content that drove the most progress and the ones that slipped. Add context that explains why numbers moved, such as a seasonal dip, a new campaign, or a recently updated page. Without that context, stakeholders fill in the gaps with their own assumptions, and those are rarely generous.
A steady rhythm helps too. Weekly checks can catch technical problems early, monthly reports can track trends, and quarterly reviews can connect content to revenue and pipeline. An SEO monitoring checklist covering what to track weekly, monthly, and quarterly keeps reporting focused, so each review answers the questions that matter at that stage instead of repeating the same numbers.
Connecting Content Data With Sales and CRM Records

Analytics platforms show what happens on the website, but many of the most important outcomes happen later, inside a sales pipeline or customer database. A lead that came from a blog post might take weeks to become a paying customer, and that final step rarely shows up in standard analytics reports. Connecting form submissions and source data to your CRM closes that gap, so you can see which content pieces produced leads that actually turned into revenue rather than just inquiries.
Even a simple setup can make a big difference. Capturing the landing page and original traffic source with each form submission lets the sales team see where every lead started its journey. Over a few months, patterns appear, such as certain guides attracting larger clients or specific topics producing leads that close faster. Those patterns are far more persuasive in a budget meeting than any engagement number on its own. Those patterns also point toward proven tips to generate organic leads from the topics already doing the work.
Using Reports to Shape What You Create Next
Reporting should change what happens next; otherwise, it is just record-keeping. When the data shows which topics attract qualified visitors and which formats lead to action, those insights should feed directly into the content plan. High-performing pieces can be refreshed, expanded, or turned into related assets, while content that consistently underperforms can be improved, merged with stronger pages, or retired altogether.
Over time, this loop builds a clear picture of what your audience values and what moves them toward a decision. It also strengthens the case for continued content investment, because every report shows a direct line between published work and business results. That kind of evidence protects budgets, builds confidence with leadership, and earns content a real seat in strategic planning conversations.
Read More: Content Pruning: How Deleting Pages Can Boost Your SEO Rankings
Making Content Reports Count

Engagement metrics are a starting point, not a finish line. When each piece of content has a defined role, micro-conversions show how readers progress, and attribution gives fair credit, reports begin to tell a story leadership can act on. Clear summaries, steady review cycles, and the habit of feeding insights back into planning turn reporting into one of the most useful tools any marketing team has.
At The Ocean Marketing, we create and measure content with business goals in mind, so every article has a purpose and a way to prove its value. Our Content Writing team plans topics around real search demand and customer questions, and a free SEO audit can show how your existing content is performing today. Contact us to talk about building content you can measure with confidence.
Frequently Asked Questions
What is content performance reporting?
It is the process of measuring how content contributes to business goals. A strong report combines engagement data, such as visits and engaged time, with outcomes like leads, signups, and sales.
Which engagement metrics matter most?
It depends on the content's purpose. Awareness content is best judged by new users and engaged sessions, while conversion-focused content should be measured by form fills, calls, and other actions that lead to revenue.
How often should content performance be reported?
Many teams review technical and traffic changes weekly, trends monthly, and business impact quarterly. The right rhythm depends on how often you publish and how long your sales cycle runs.