

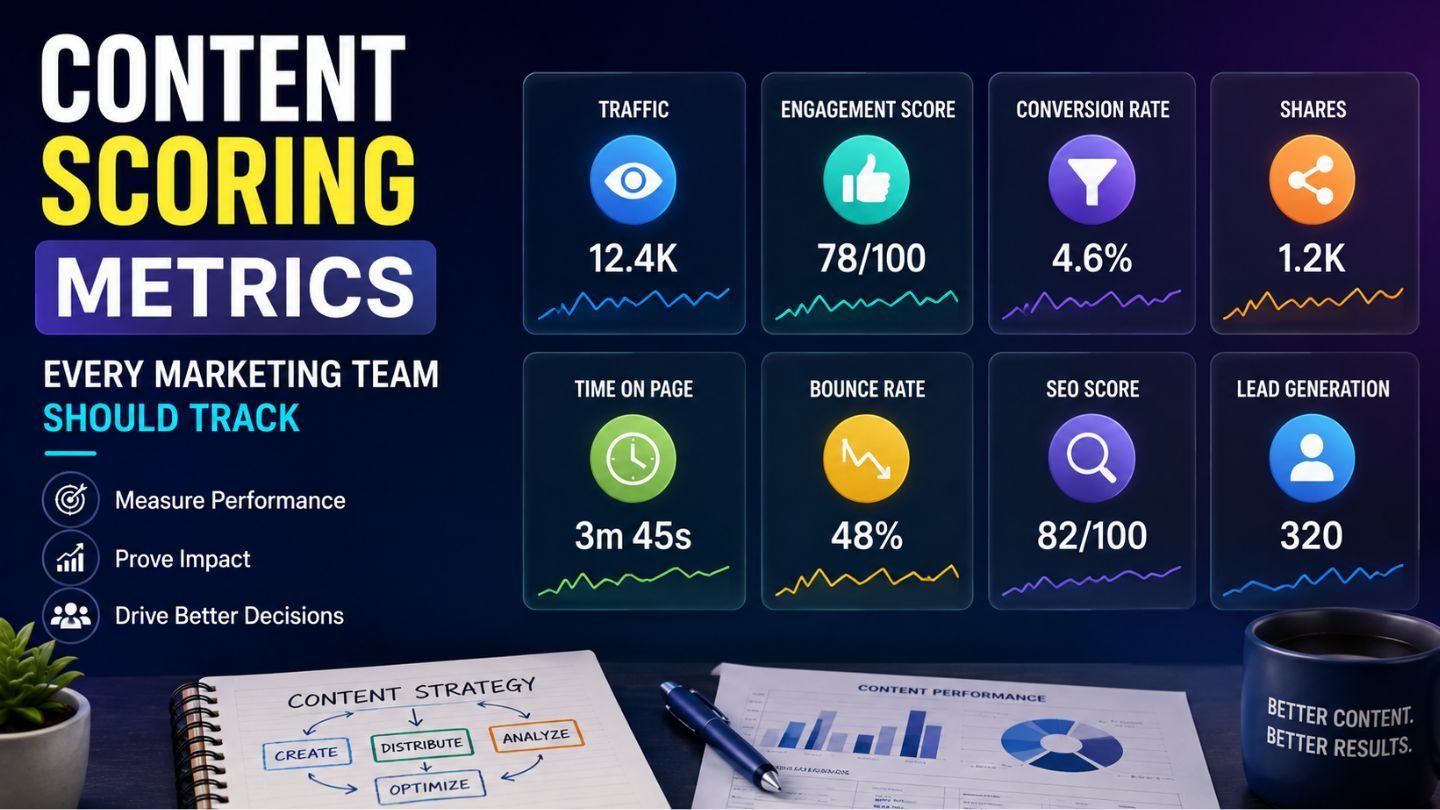
Most content teams measure pageviews and stop there, which explains why so many of them can’t answer whether their content is working. Pageviews tell you people arrived. They say nothing about whether anyone read it, trusted it, acted on it, or came back. Content scoring fixes that by combining signals into something that reflects actual performance. This blog covers which metrics genuinely indicate content quality, which ones mislead, how to combine them sensibly, and how to avoid building a scorecard nobody uses.
Key Takeaways
- Pageviews measure arrival, not value delivered.
- Engagement depth reveals whether content held attention.
- Conversion contribution matters more than traffic volume.
- Content decay is only visible if you measure over time.
- A scorecard nobody acts on is worse than no scorecard.
Why Pageviews Mislead So Consistently
A page with twenty thousand monthly views sounds like a success until you look at what happens after arrival. If the average visitor leaves in eleven seconds, having read the first line and realized it wasn’t what they wanted, those twenty thousand views represent twenty thousand small disappointments and zero business value.
The reverse is more common than people expect. A page with three hundred monthly views that consistently produces qualified leads is doing more work than the traffic magnet, and it’ll get deprioritized in every meeting where pageviews are the headline number. Measuring arrival alone systematically rewards the wrong content and quietly buries the right content, which is why teams end up optimizing toward things nobody wanted.
Metrics That Actually Indicate Quality
Engagement depth is where to start. Scroll depth, time on page relative to reading length, and whether people reached the section that mattered. These tell you whether content held attention rather than merely attracting it. A three-thousand-word guide with an average scroll depth of eighteen percent is a two-thousand-five-hundred-word waste.
Then conversion contribution, which is harder to measure and worth the effort. Not just last-click, because content rarely converts directly, but assisted conversions and the paths people took. A piece that appears repeatedly in the journey of customers who eventually buy is valuable even if it never converts anyone by itself. Understanding how content tone impacts dwell time and rankings helps explain why engagement depth correlates with outcomes rather than just looking nice on a chart.
Return Visits Signal Real Value
Someone coming back to a page they’ve already read, or bookmarking it, is a stronger quality signal than any first-visit metric. It means the content was worth keeping.
Read More: How Skimmable Content Boosts Engagement & Conversions
The Metrics That Deceive

Bounce rate is the worst offender. A high bounce rate on a page answering a specific question might mean the content failed, or it might mean it succeeded completely and the visitor left satisfied. The number alone can’t distinguish those, and teams treat it as a verdict anyway. The number only means something once you know what actually drives a high bounce rate on that kind of page.
Average time on page has similar problems, since it can’t tell reading from an abandoned tab. Social shares correlate weakly with business value; plenty of shared content converts nobody. And keyword rankings describe visibility rather than performance; a page at position two that nobody clicks is losing to a page at position six that everybody does. Each of these is worth knowing, and none of them is worth trusting alone.
Building a Score That Means Something
The point of combining metrics is to stop any single one from dominating. A reasonable composite might weight conversion contribution most heavily, engagement depth next, then organic visibility, then traffic. The exact weights matter less than the fact that they reflect what your business actually wants from content.
That’s the part teams skip. A scorecard borrowed from a blog post about scorecards will weigh things your business doesn’t care about, and everyone will quietly ignore it. If your content exists to generate leads, weigh lead contribution. If it exists to support sales conversations, measure whether sales uses it. Define what success means first, then build the score around it, not the reverse.
Measuring Decay, Not Just Snapshots
A single-point score tells you how a page is doing today and nothing about where it’s heading. Content ages, competitors publish, search results shift, and a piece that scored well six months ago may be sliding without anyone noticing, because nobody looks at pages that were fine last time they checked.
Tracking scores over time surfaces that. A page trending downward over three consecutive reviews needs attention now, while it still has authority worth preserving, rather than after it’s dropped off page one entirely. This is where scoring earns its keep; it turns content decay and traffic recovery from a crisis you discover into a trend you manage.
Scoring Content You Didn’t Publish for Traffic
Not every page exists to attract strangers, and scoring it as though it does produces nonsense. Case studies that sales sends to prospects. Documentation that reduces support load. Comparison pages that exist to be found by people already evaluating you. Each has a job, and none of those jobs is measured by organic sessions.
Score them against what they were for. Do sales actually use the case study, and do deals close faster when they do? Did support tickets on that topic fall after the doc went up? Is the comparison page in the path of people who convert? These are harder numbers to gather, and they’re the only honest ones. A page that generates no traffic and closes deals is not underperforming; it’s being measured by the wrong instrument. Knowing what makes an effective case study is part of scoring one honestly.
Making the Scorecard Actually Get Used
Most content scorecards die of complexity. Twenty metrics, weighted formulas, a dashboard that takes an hour to update, and after two months, nobody opens it. The scorecard that survives is the one simple enough to maintain and clear enough to act on.
Tie each score band to a decision. High score and stable, leave it alone. High score and declining, refresh it now. Low score with good traffic; fix the conversion path. Low score with no traffic; consider pruning it. If the score doesn’t map to an action, it’s information rather than a tool, and information nobody acts on is just overhead. Deciding what to cut is its own discipline, which is where content pruning becomes part of the same system rather than a separate project.
Attribution Is Hard and Worth Attempting Anyway
Content rarely converts on its own, which makes last-click attribution actively misleading for measuring it. The guide someone read three weeks before contacting you gets no credit, while the pricing page they landed on right before filling the form gets all of it. Both were necessary, and only one shows up.
You won’t solve this perfectly, and imperfect attempts beat ignoring it. Assisted conversion reports, path analysis, or simply asking new customers what they read before getting in touch will each surface content that’s doing real work invisibly. The alternative is a scorecard that systematically undervalues everything above the bottom of the funnel, which is most of your library.
Read More: First-Click vs Last-Click Attribution in Paid Campaigns
Benchmarking Against Yourself
Comparing your content metrics to published industry averages produces very little. The averages aggregate wildly different businesses, audiences, and content types, and knowing that some notional average time on page is two minutes tells you nothing about whether yours is good.
Your own history is a useful benchmark. How does this piece compare to the last ten you published on similar topics? Is engagement in your library trending up or down over a year? Those questions have actionable answers. "Are we above average?" doesn’t, because the average describes nobody and you can’t act on it either way.
Scoring Should Change What You Publish

The final test of a scorecard is whether it influences the editorial calendar. If your scoring consistently shows that comparison pieces outperform listicles for your audience, and you keep commissioning listicles because they’re easier, the scorecard is decoration.
Feeding the data back into what gets written is where the compounding starts. Over a year, a team that lets its scoring shape its commissioning ends up with a library weighted toward what works, while a team that measures and ignores ends up with the same library it would have had anyway, plus a dashboard. The measurement was never the point.
Scoring Cadence and Who Owns It
A scorecard reviewed whenever someone remembers is a scorecard that stops being reviewed. Quarterly works for most libraries, monthly if you publish heavily, and the specific interval matters less than it being fixed and owned by a person rather than a team in general.
The review needs a decision attached, or it becomes a reporting ritual. Each piece gets an outcome: leave, refresh, expand, consolidate, or prune. Sitting in a meeting agreeing that engagement is down, and then doing nothing until the next quarter when engagement is down further, is a use of time that feels like management and isn’t.
Measuring What Content Is Really Worth
Content scoring exists because pageviews answer the wrong question. What matters is whether content held attention, contributed to outcomes, and is holding up over time, and no single metric captures that. Combine engagement depth, conversion contribution, and visibility into something weighted around what your business actually needs, track it across reviews rather than as a snapshot, and tie every score band to a decision. Do that, and the scorecard stops being a report and starts being the thing that tells you where to spend next.
At The Ocean Marketing, we help businesses build content writing programs measured against outcomes rather than vanity metrics. Whether you want help defining what your content should be judged on, auditing a library that’s quietly decaying, or starting with a free SEO audit to see how your pages are performing, our team can help. Contact us and let’s work out what your content is really worth.