
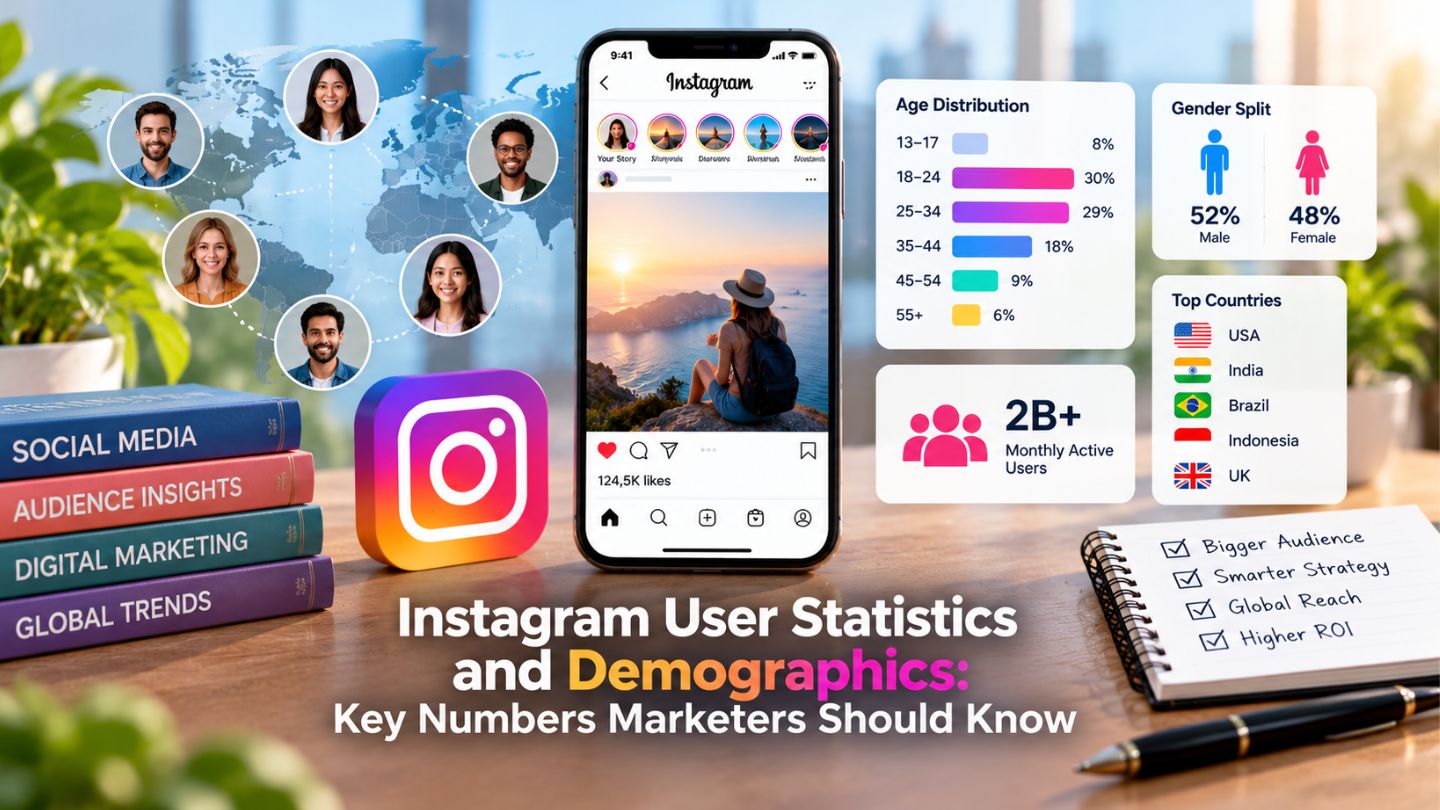
Platform statistics get quoted constantly and applied carelessly. Knowing that a particular age group dominates a platform globally tells you very little about whether your customers are among them, and decisions built on headline numbers frequently miss the mark. This blog covers which Instagram figures genuinely matter for marketing decisions, how to read demographic data without over-generalizing, and how to check whether the platform-wide picture actually describes your own audience.
Key Takeaways
- Platform-wide demographics rarely describe your specific audience.
- Usage patterns matter more than raw user counts.
- Regional variation is large enough to invalidate global figures.
- Your own account data is more reliable than any published statistic.
- Statistics inform strategy; they do not decide it.
Why Headline Numbers Mislead
A statistic describing billions of users is an average across markets, industries, and use cases that have very little to do with each other. Applying it to a specific business is like using a national income figure to set your own budget: technically accurate, practically useless for the decision in front of you.
The typical failure is a business concluding a platform is wrong for them because the dominant age bracket does not match their customer, when the minority bracket still represents an enormous absolute number of people. Percentages hide scale, and scale is what determines whether a channel can work for you.
Which Figures Actually Matter
Usage frequency and session behavior tell you more than user counts. How often people open the app, how long they stay, and which formats they spend time in determine whether your content has a realistic chance of being seen, and those patterns differ sharply by age and region.
Purchase behavior on the platform is the other genuinely decision-relevant category: whether people research products there, follow businesses, or act on what they see. A demographic that uses the platform heavily but never engages commercially is a poor target regardless of how large it is.
Read More: Instagram Likes, Saves, Shares & Watch Time: Which One Matters Most?
Behavior Matters More Than Age Brackets
Demographic tables are easy to publish and describe the least actionable dimension. What someone does on the platform, whether they search, follow businesses, save posts, or act on recommendations, predicts commercial value far better than which age bracket they fall into.
Two people of the same age can use the platform in entirely different ways, and a segment described as small by age share may be disproportionately valuable by behavior, which is why reels and carousels suit different audiences and goals. Where behavioral data is available, it deserves considerably more weight than the demographic breakdown that usually leads the report.
Regional Variation Undercuts Global Figures

Adoption, age distribution, and format preference vary enormously between markets. A global statistic is dominated by the largest user bases, which may bear no resemblance to the country or city you actually sell in. For a local business, the global figure is close to irrelevant.
Where regional data exists, it is worth considerably more. Where it does not, your own account insights are the better source; this is the same reasoning behind checking what accounts reached measures actually before acting on it. The specific definition and context matter more than the headline number.
Absolute Numbers Beat Percentages
A demographic representing a small share of a very large platform is still an enormous audience. Convert percentages into approximate counts for your market before dismissing a segment.
Following Versus Buying
A follower audience and a customer base can differ substantially, and a platform that attracts one without producing the other is easy to misread as successful. Content can perform well by every platform metric while reaching people who will never purchase.
Checking whether inquiries and customers actually come through the channel, rather than whether the channel produces engagement, answers the question that matters. It occasionally leads to the uncomfortable conclusion that a well-performing account is not commercially useful. Mapping the gap properly is what a social media funnel is for.
Your Own Data Is the Better Source
Instagram insights show the actual age, location, and activity pattern of the people already following you, which is more directly useful than any published research. If your audience skews differently than the platform average, that is the reality your content should serve.
It is worth comparing that against your actual customer base too, since a follower audience that does not resemble your buyers means the content is attracting the wrong people. That mismatch is invisible if you only look at platform statistics, and it explains a lot of accounts with healthy engagement and no commercial return.
Comparing Yourself Against the Right Benchmark
Published engagement benchmarks average across industries with wildly different norms, which makes them a poor standard for any specific business. A rate that looks weak against a global average may be strong within your sector, and the reverse is equally common.
Your own historical performance is the more useful comparison, since it controls for industry, audience, and content type automatically. Tracking whether you are improving against yourself answers the question that actually matters more reliably than measuring against a number assembled from businesses unlike yours. Where an external comparison is genuinely useful, a proper social media competitive analysis beats a published average.
Using Statistics Without Being Misled
The reasonable role for published figures is orientation: confirming a platform is worth considering, understanding broad format trends, and providing context for a strategy discussion. They are a starting point for a question, not an answer to one.
Where they get misused is as justification for decisions already made. A statistic selected because it supports the preferred conclusion is not evidence, and this is common enough that it is worth asking what number would have changed the decision. If none would have, the statistic was decoration.
Checking a Statistic Before You Repeat It
Published marketing figures are frequently recycled through several sources until the original context disappears. Before building a decision on one, check who produced it, when, what population it covered, and whether the definition matches what you think it means.
Check the age of every statistic against what it describes. Feature, algorithm, and format-performance data can become outdated quickly, while broader demographic trends may remain useful for longer. A statistic about format performance from three product cycles ago may describe a version of the app that no longer exists, which is a common and avoidable source of outdated strategy. Reviewing how content reach actually behaves now is often more useful than an older aggregate figure.
Using Data to Decide Where Not to Invest

The most valuable conclusion a statistic can support is sometimes that a platform is not worth your effort. A business whose customers demonstrably are not present, or are present but never act commercially, is better served putting that time elsewhere.
That conclusion is unpopular because it removes an activity from the plan, and it is frequently the correct one. Deliberately deciding not to invest, based on evidence, is a better position than maintaining a channel out of obligation when it produces nothing measurable.
How Often to Revisit the Question
A full demographic review may not need to happen every month, but audience fit should be reassessed periodically and whenever the business, target market, or platform behavior changes materially. What changes faster is format behavior, which is worth watching more closely since it affects execution rather than whether the channel is right at all.
Setting a fixed point to revisit the underlying question- is this platform still where our customers are- prevents both extremes: abandoning a channel on one weak quarter, and maintaining one for years out of habit after the audience moved.
Read More: What You Need to Know to Create a Social Media Budget
Reading the Numbers Sensibly
Instagram statistics are useful for orientation and unreliable as a basis for specific decisions. Global demographics rarely describe a local audience, percentages hide absolute scale, and figures more than a couple of years old may describe a platform that has since changed. Your own insights, compared against your actual customer base, answer the question that matters: whether the people you are reaching are the people you want. Use published numbers to frame the question and your own data to answer it.
At The Ocean Marketing, we build social media marketing around the audience a business actually has rather than the one a headline statistic implies. Whether you need help reading your own account data, working out whether a platform fits your customers, or a free SEO audit to see how your wider presence performs, our team can help. Contact us and let's find out who you're actually reaching.